Why Your Workplace Productivity Statistics Fall Short—and How to Fix Them


Hable con el departamento de ventas
Nuestro equipo dedicado está aquí para responde a todas sus necesidades personalizadas.
Key Takeaways:
- Most workplace productivity data captures activity like hours worked, tools used, and tasks completed, but fails to show whether work drove results.
- The core problem is a visibility gap; surface productivity statistics tell you what happened, but not whether it moved the business forward meaningfully.
- Activity metrics and business outcome metrics require a deliberate translation layer connecting behavioral workforce data to financial and operational results.
- Workforce analytics platforms bridge the gap by connecting time-use data, productivity trends, and operational output to measurable business performance indicators.
- Leaders evaluating workforce analytics vendors should ask whether the platform links workforce behavior directly to revenue, delivery speed, and margin impact.
Organizations are flooded with data, yet real clarity is harder to find than ever. Dashboards are full. Reports are frequent. But many leadership teams still struggle to answer a basic question: Are we actually operating efficiently?
The disconnect comes down to this: most workplace productivity statistics tell you what happened, but not whether it mattered. You can see hours worked, tools used, and tasks completed. However, that doesn’t necessarily tell you whether the work moved the business forward.
So the problem isn’t a lack of workplace productivity data. It’s that the data stops short of becoming useful. This article focuses on closing that gap, offering a framework to make productivity data decisions relevant and to turn workplace productivity statistics for leadership into something that actually drives meaningful outcomes.
The Productivity Data Leadership Should Know About
A closer look at a few high-impact workplace productivity statistics makes the scale of the problem much clearer.
Research shows that only about 20% of employees are actively engaged at work. This means that a large share of paid capacity is not translating into meaningful output, directly impacting productivity and cost efficiency.
The issue is not just engagement. It is how work actually happens.
Work fragmentation adds another layer of loss. One in five employees loses more than two hours each week switching between tools, which adds up to over 100 hours per year per employee. Nearly 17% switch between apps more than 100 times a day, while 56% say this constant switching negatively affects their work each week.
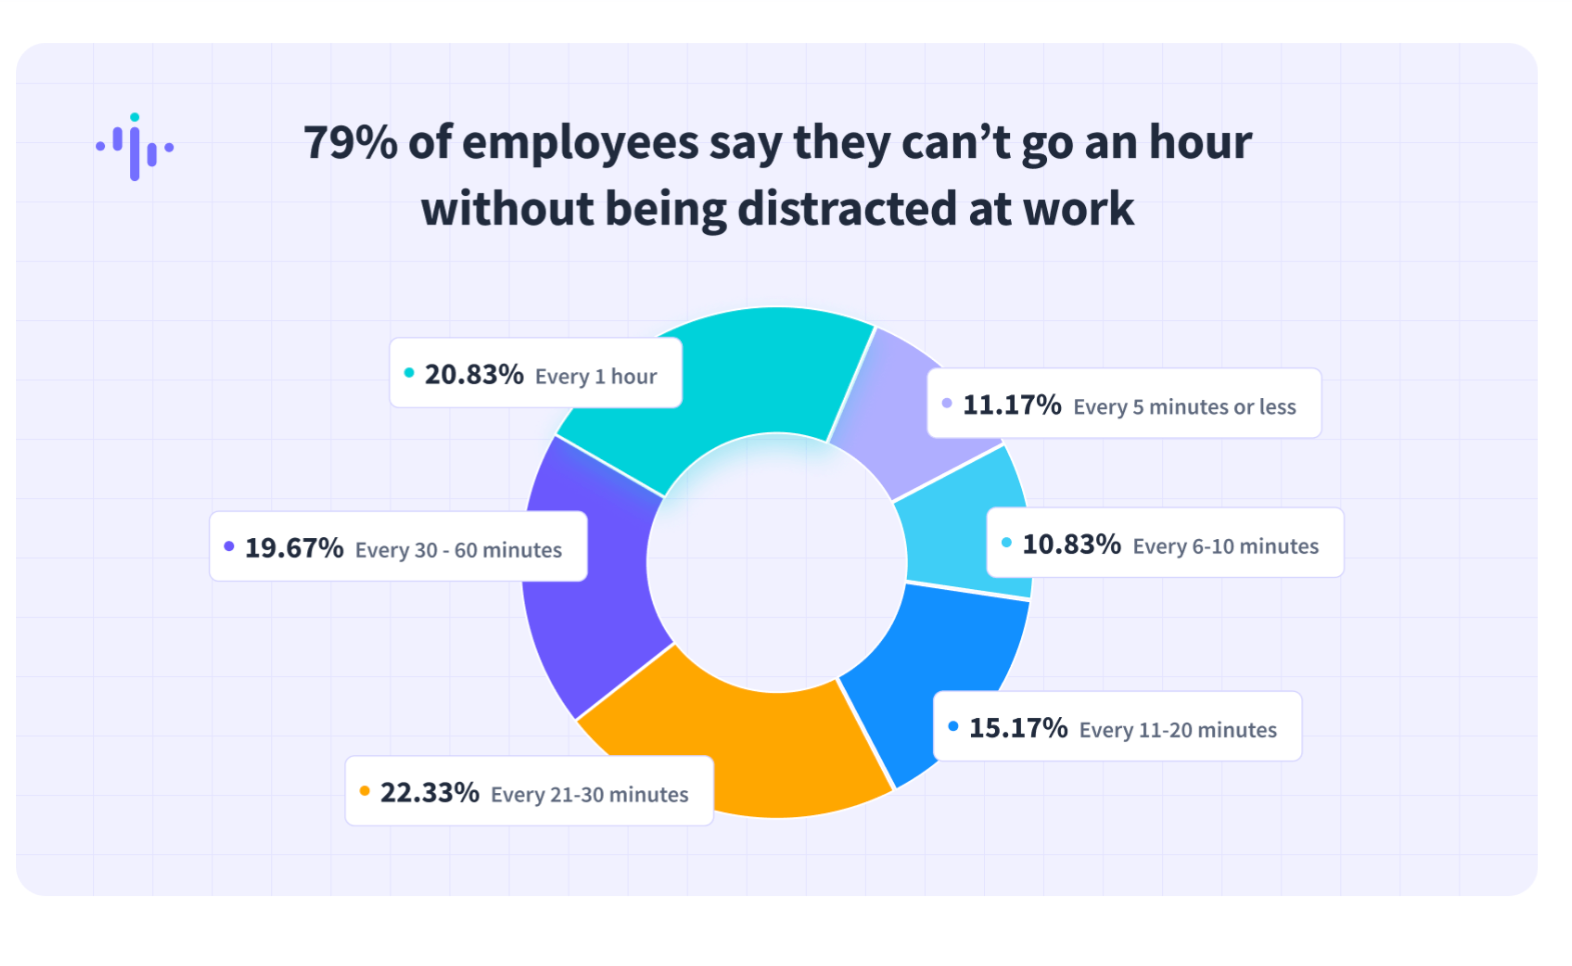
Almost 79% of employees say their company has not taken action to reduce tool fatigue, and 45% say digital tools actively hinder productivity.
At scale, even small inefficiencies compound quickly. In a 500-person organization, these lost hours translate into thousands of hours of unrealized capacity each month.
What looks like small, everyday inefficiencies is actually a larger visibility gap. These workplace productivity statistics for leadership highlight how limited visibility into work impacts efficiency, increases costs, and ultimately affects overall business performance.
Why Most Productivity Data Stops at the Activity Layer
Most workplace productivity data focuses on what is easiest to capture. You can track hours worked, see which tools employees use, and count tasks completed. On the surface, this creates a clear and detailed view of activity.
But activity alone does not tell you much about progress. Many workplace productivity statistics show that work is happening, yet they do not show whether that work is actually driving results. Are teams improving delivery speed? Are they using time efficiently? Are they contributing to revenue or output?
The missing piece is a layer that connects effort to outcomes. That is harder to build, and most tools stop before getting there.
As a result, leadership teams are left with dashboards that look comprehensive but offer little direction on what to change or where to act.
The Productivity Metrics That Actually Connect to Business Outcomes
If you want workplace productivity statistics to actually guide decisions, the focus needs to shift from activity to impact. So what are the key metrics that tie directly to team outcomes—and your bottom line?
Revenue or Output Per Employee
Revenue or output per employee shows how much value each person contributes. For finance leaders, it ties directly to margins and profitability. For operations leaders, it highlights whether growth is coming from better efficiency or simply adding headcount.
It will vary across roles and business units, but it remains one of the most important workplace productivity statistics for leadership.
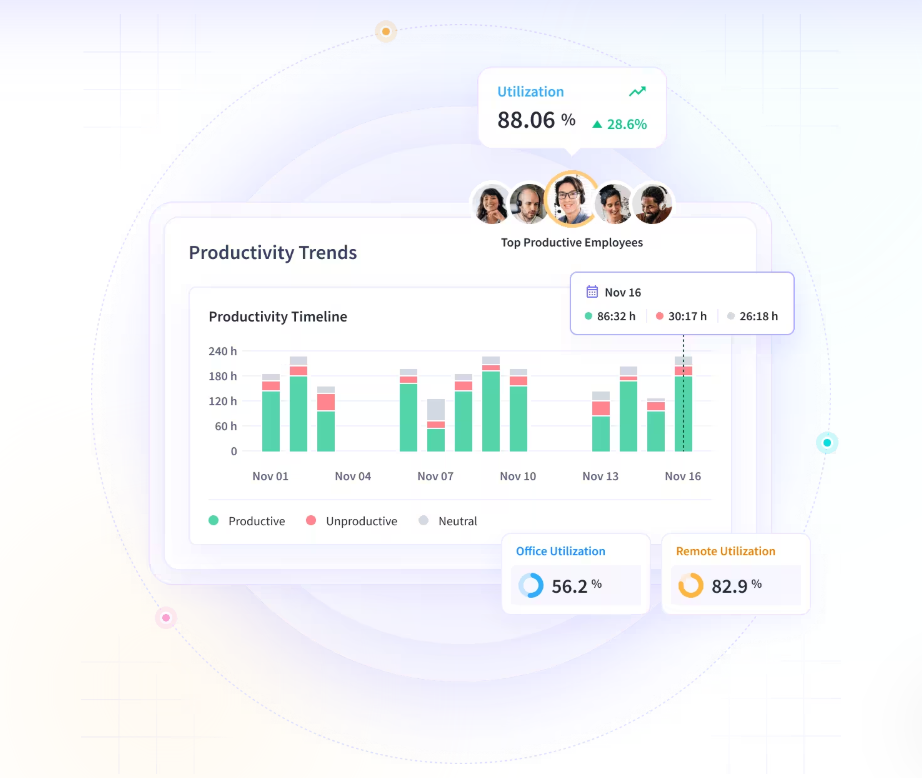
Utilization Rate Against Target
Not all hours carry the same value. What matters is how much time is actually productive or billable. Utilization compares productive time against expected targets, and the gap between the two is where efficiency is often hiding.
This is where strong workplace productivity data makes a difference, helping teams understand how time is spent and whether it aligns with business priorities. Insightful’s utilization calculations bring this clarity without manual tracking.
Focus Time vs. Fragmented Time Ratio
This metric looks at the quality of work, not just quantity. Focused time is when meaningful progress happens, while fragmented time slows execution. For distributed teams, this balance matters even more. Insightful’s Lost Focus Report shows how daily activity translates into workplace productivity statistics—and your team’s ability to do deep work vs. facing constant interruptions.

Capacity vs. Demand Gap
This metric answers a simple but critical question: Do you have the right capacity to meet current and future demand? Too much capacity leads to underutilization, while too little leads to delays and burnout. Strong workplace productivity data makes this visible early, allowing teams to rebalance workloads and plan before issues affect delivery or retention.
How to Align Productivity Data with Business Decisions
Translating workplace productivity data into real decisions doesn’t require more dashboards. It requires a structured way to connect work inputs to business outcomes.
- Define your core business outcomes: Identify two or three metrics your leadership team tracks most closely, such as revenue per employee, project delivery timelines, or cost per output unit. These become your anchor points.
- Map leading workforce inputs: Work backwards to identify the inputs that influence these outcomes. This could include utilization rates, focus time, or task cycle times. This is where workplace productivity statistics begin to provide real context.
- Connect these inputs to the right data sources: Capture the inputs you identified through consistent, real-time tracking across tools and workflows. The goal is to build reliable workplace productivity data that reflects how work actually happens.
- Create a connected reporting layer: Build reports that connect the dots, not simply another activity dashboard. When workplace productivity statistics for leadership are tied to business results, it becomes much easier to see what is working and what needs attention, and to act on it with confidence.
What Actionable Precision Looks Like in Practice
When workplace productivity statistics are connected to outcomes, the difference is immediate. Leaders can spot inefficiencies before they turn into delays. Staffing decisions are based on real capacity, not estimates. Conversations about productivity become grounded in data, not assumptions.
For instance, at Peach Payments, limited visibility into remote work made it difficult to accurately measure performance and plan capacity with confidence. With Insightful, leadership gained real-time insight into workflows, productivity, and workload distribution across teams and locations. This shift helped the company achieve 40% business growth and a 22% increase in remote team productivity while reducing manual reporting and improving planning accuracy.
Conclusion
The problem is not a lack of workplace productivity data, but that most tools stop before that data becomes useful. Without a clear link to outcomes, even the most detailed workplace productivity statistics will remain surface-level.
What makes the difference is turning visibility into action. When you can clearly see how work connects to results, decisions become faster and more confident. Insightful helps bridge that gap, connecting daily work to real business outcomes so you can improve performance, optimize capacity, and drive measurable growth. Book a demo today.
FAQs
What is the difference between activity metrics and productivity outcomes?
Activity metrics show what people do, such as hours worked or tasks completed. Productivity outcomes show the impact of that work on the business. Strong workplace productivity statistics connect the two, helping leadership understand not just effort, but results.
What productivity statistics should leadership teams track?
Leadership should focus on workplace productivity statistics that connect to outcomes. This includes utilization, output per employee, focus time, and capacity alignment. These metrics provide a clearer view of performance than basic activity data.
How do I connect employee productivity data to revenue or profitability?
Start by identifying how each role contributes to business outcomes. Then use workplace productivity data to track the inputs that influence those outcomes. Connecting effort to financial results creates meaningful workplace productivity statistics that leadership can act on.
What KPIs do COOs and CFOs use to measure workforce performance?
Common KPIs include revenue per employee, utilization rates, and cost efficiency. These are practical workplace productivity statistics for leadership because they link workforce effort directly to business performance.
How does workforce analytics software improve decision-making for leadership?
Workforce analytics software turns raw workplace productivity data into insights that connect to outcomes. It helps leaders move beyond activity tracking and use workplace productivity statistics to make better decisions about staffing, planning, and performance.
.webp)
.webp)