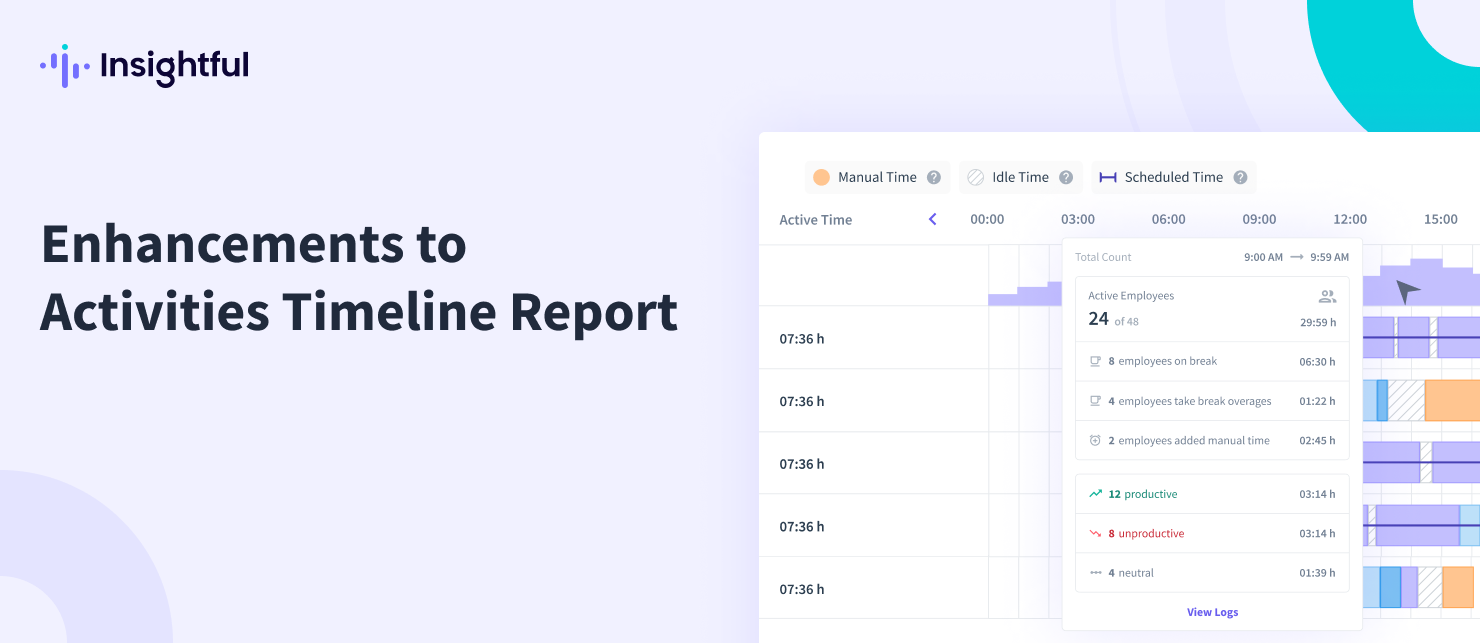
Improvement: Activities Timeline Report
We have recently enhanced our data analysis capabilities by introducing an improved Activities Timeline Report that includes data aggregation and visualization features. With this update, users can now view a summarized bar chart on the Activities' Timeline, which represents the level of employee activity per hour. This provides a clear and concise overview of employee activity patterns throughout the day: Number of active employees out of the total number of employees in the company, Number of employees on break, Number of employees taking break overages, Number of employees that added Manual Time, Number of employees that were productive, unproductive, or neutral.